CiliKube 1.0.0: AI Navigates, the Console Remains the Source of Truth
Table of Contents
Long time no see — hope you’ve been well, take care of yourself
July is almost gone; it’s been raining every day in Shenzhen and I’m still adjusting. How’s the weather on your side?
CiliKube ships a new release
About a year ago I posted a WeChat intro to CiliKube
UI was still Vue3 + Element Plus then, no public demo yet, and the piece promised RBAC, monitoring, logs for later — looking back the tone was pretty loud; I probably wouldn’t call anything a “lifesaving tool” again
One line I still stand by: I’d rather ship something you can click than only talk methodology
A year of moving to Shenzhen and messy life later, CiliKube kept pace with the AI wave and caught up on quite a bit:
Frontend moved to React; runs in the browser and as Windows / macOS / Linux desktop; some of what used to sit in the roadmap is here; more importantly — after login you land on the AI workspace first, the resource console is still there, just no longer the only door
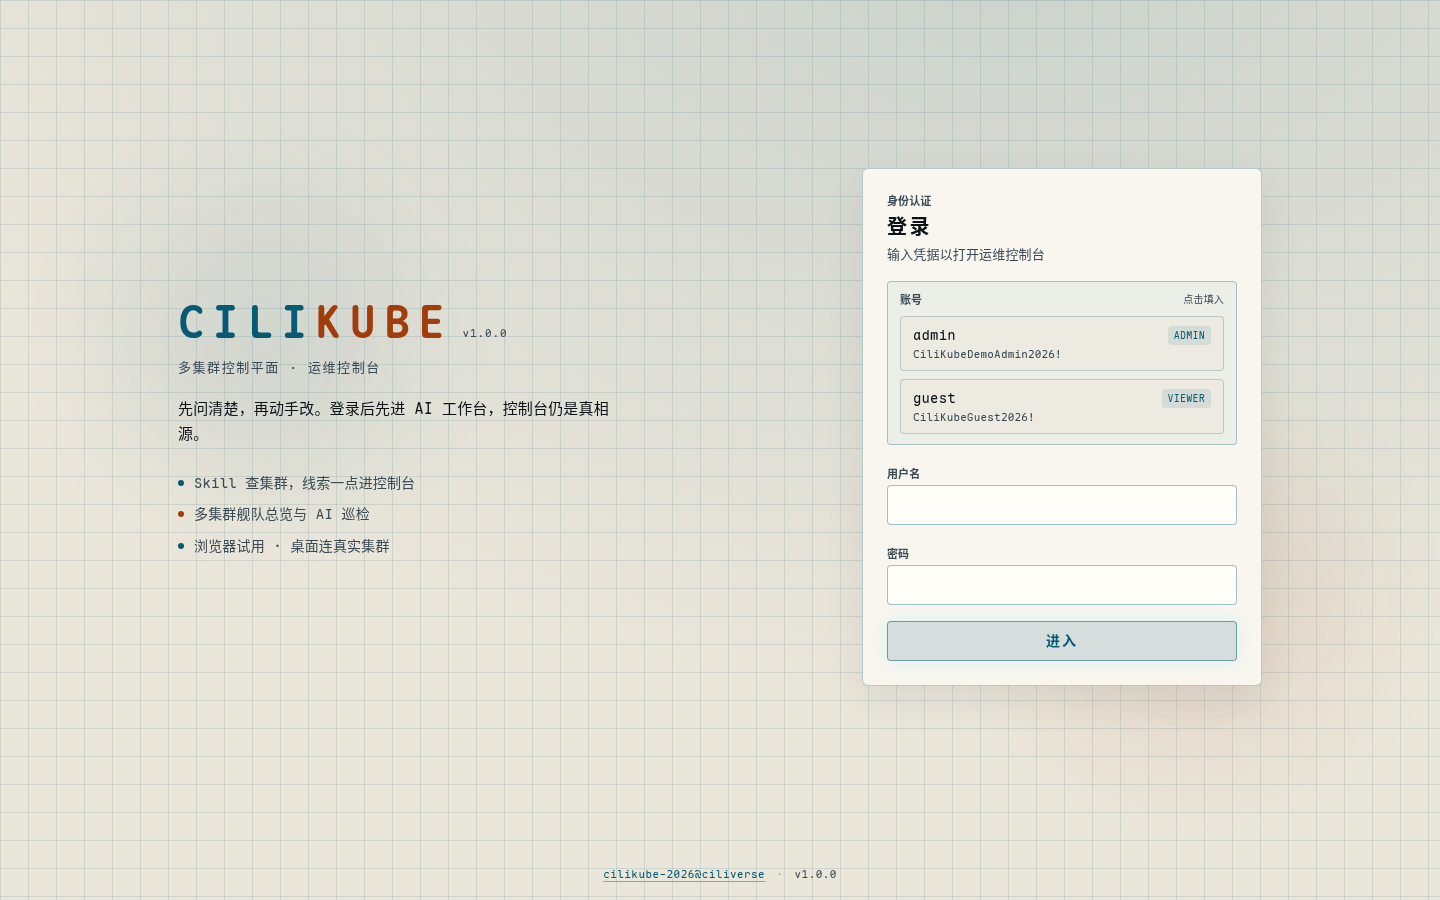
Links up front
Browser demo: https://cilikube.cillian.website
Desktop: https://github.com/ciliverse/cilikube/releases (look for packages withdesktop)
Repo: https://github.com/ciliverse/cilikube
Feature preview
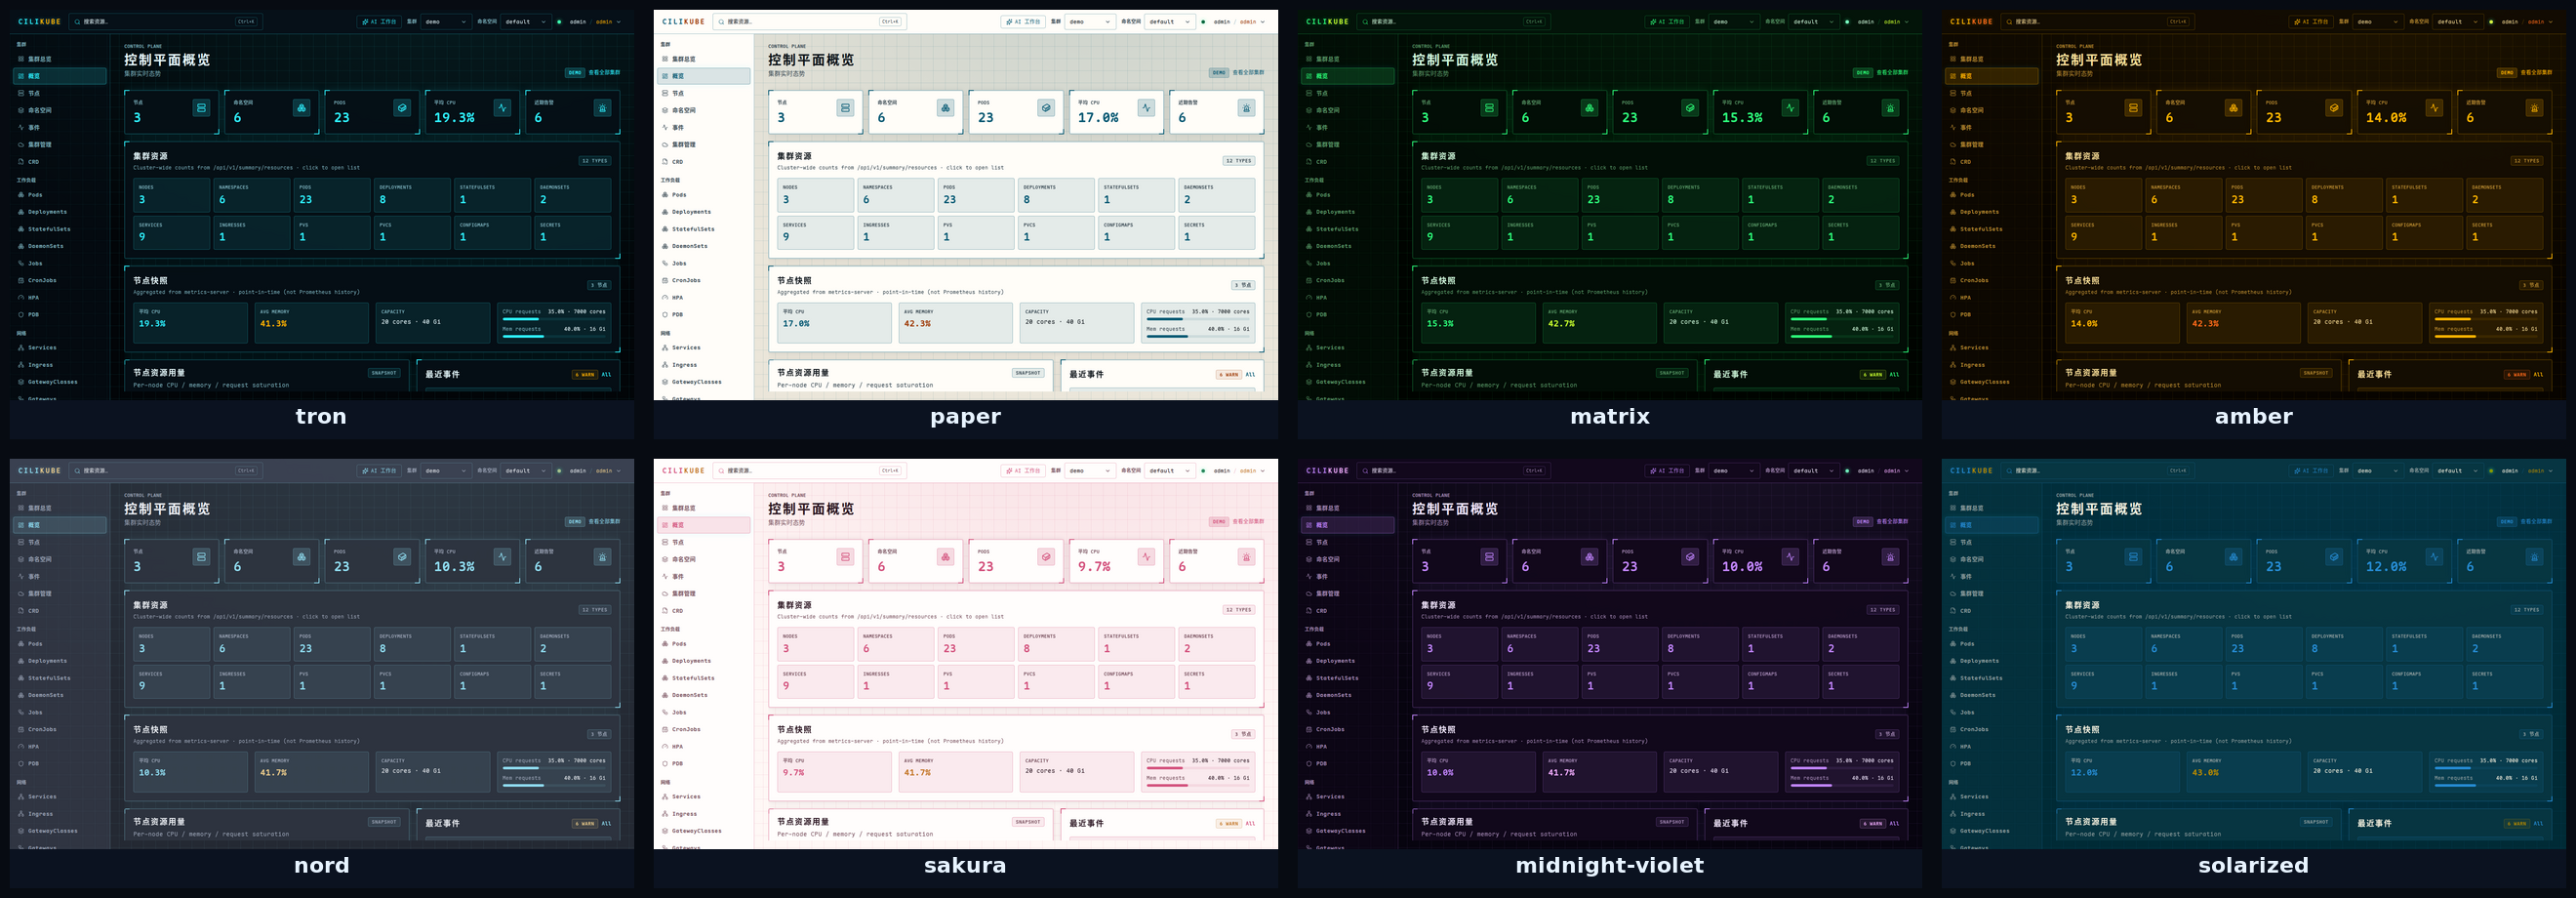
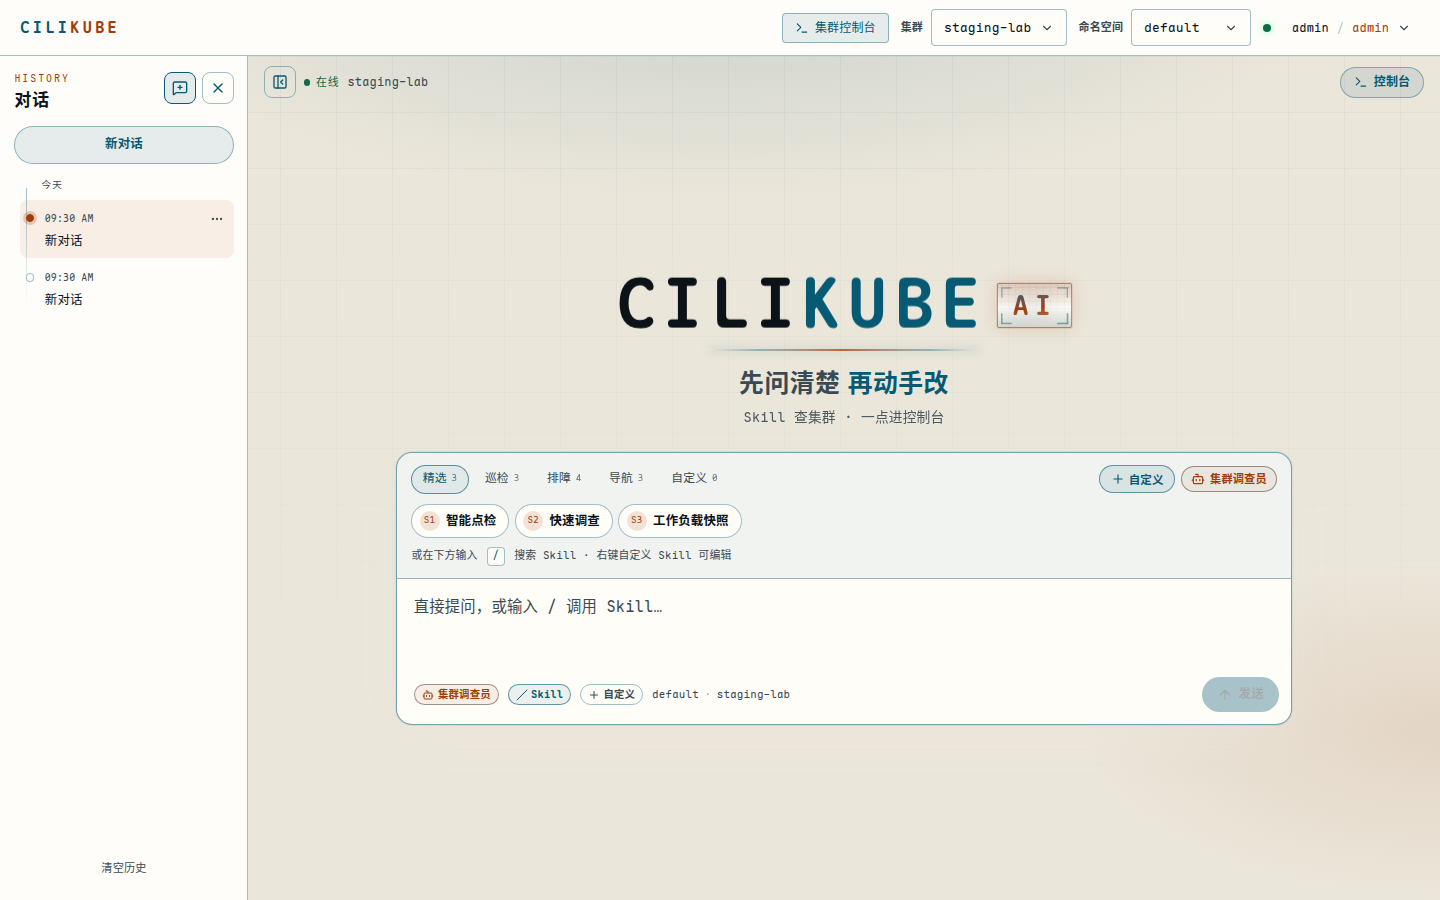
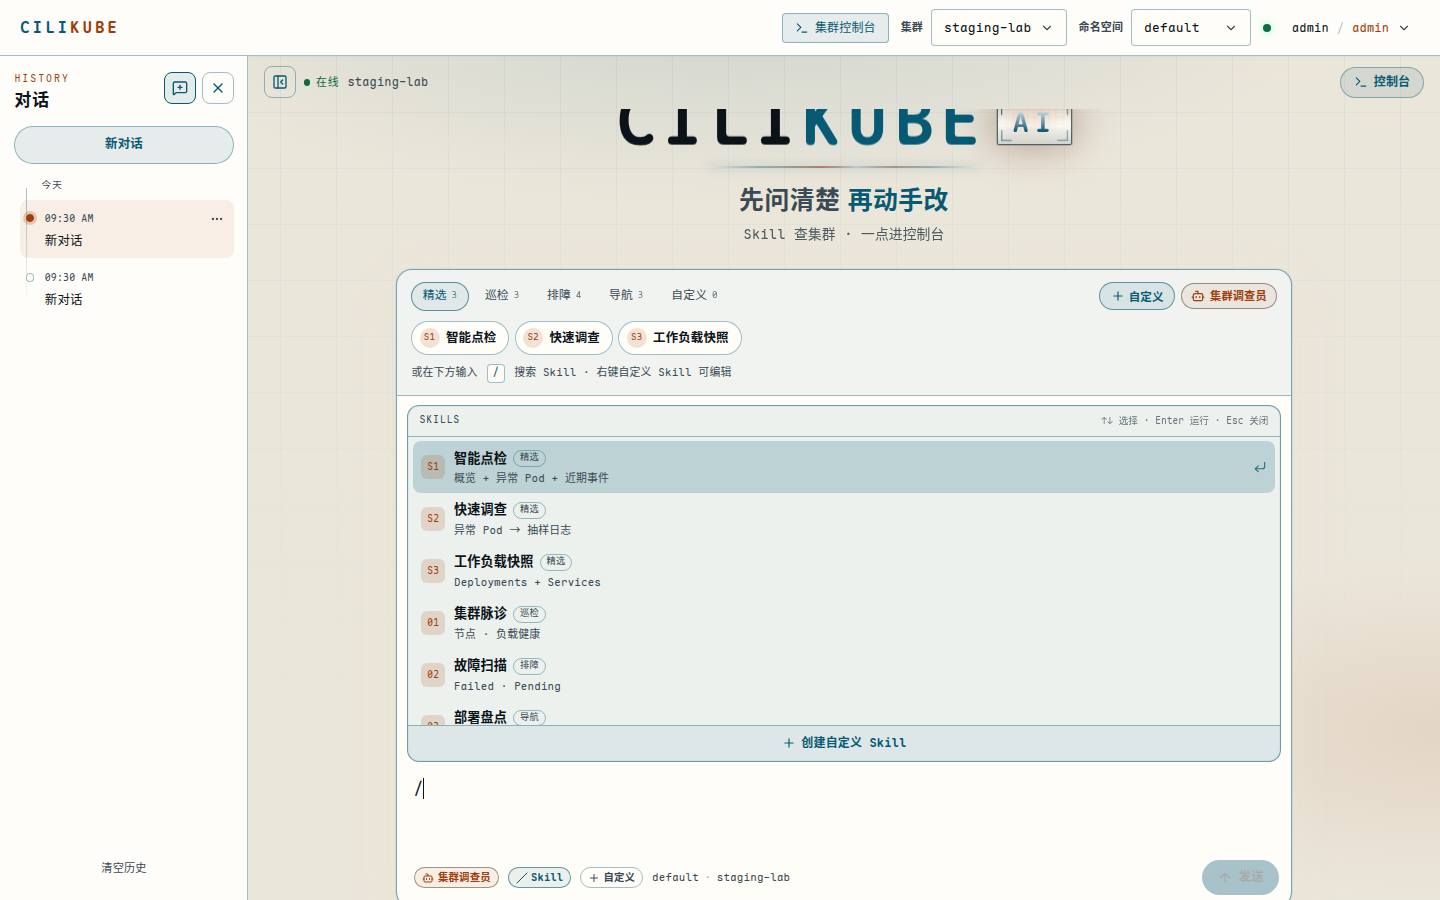
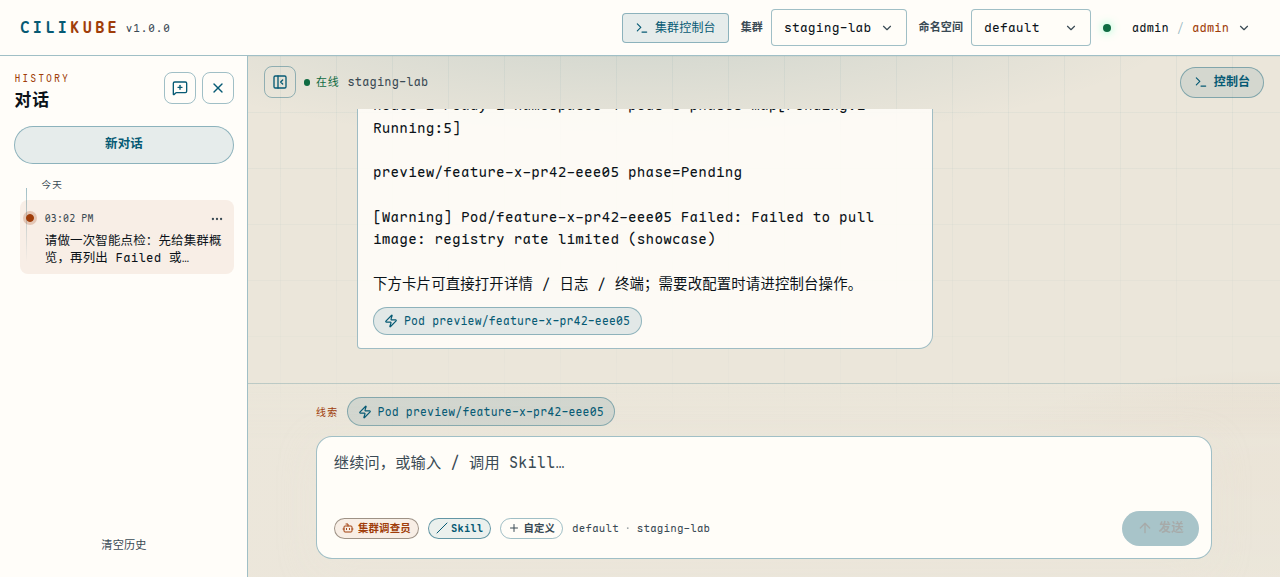
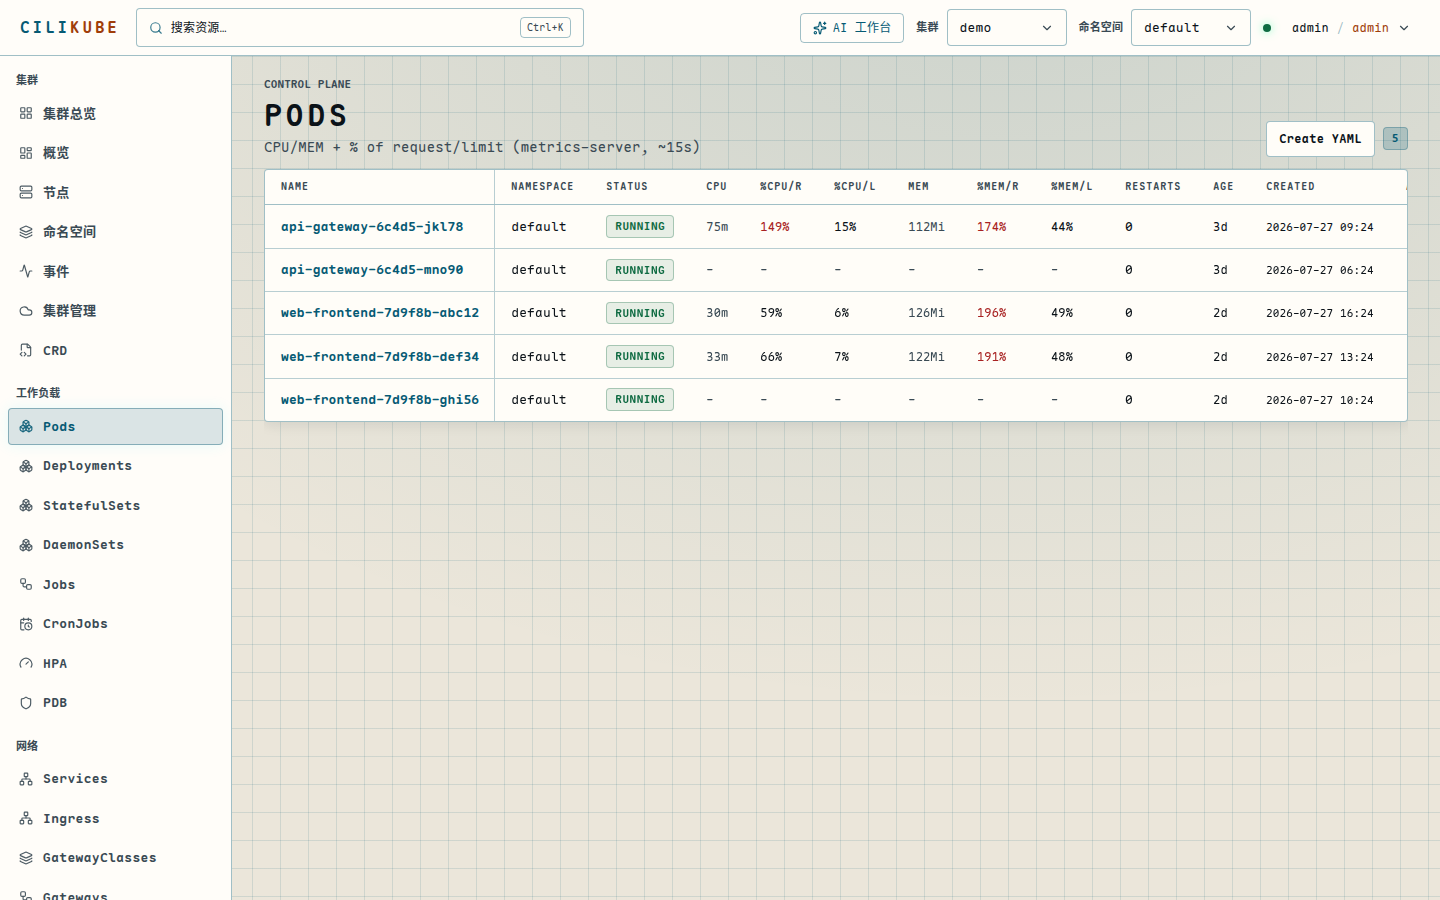
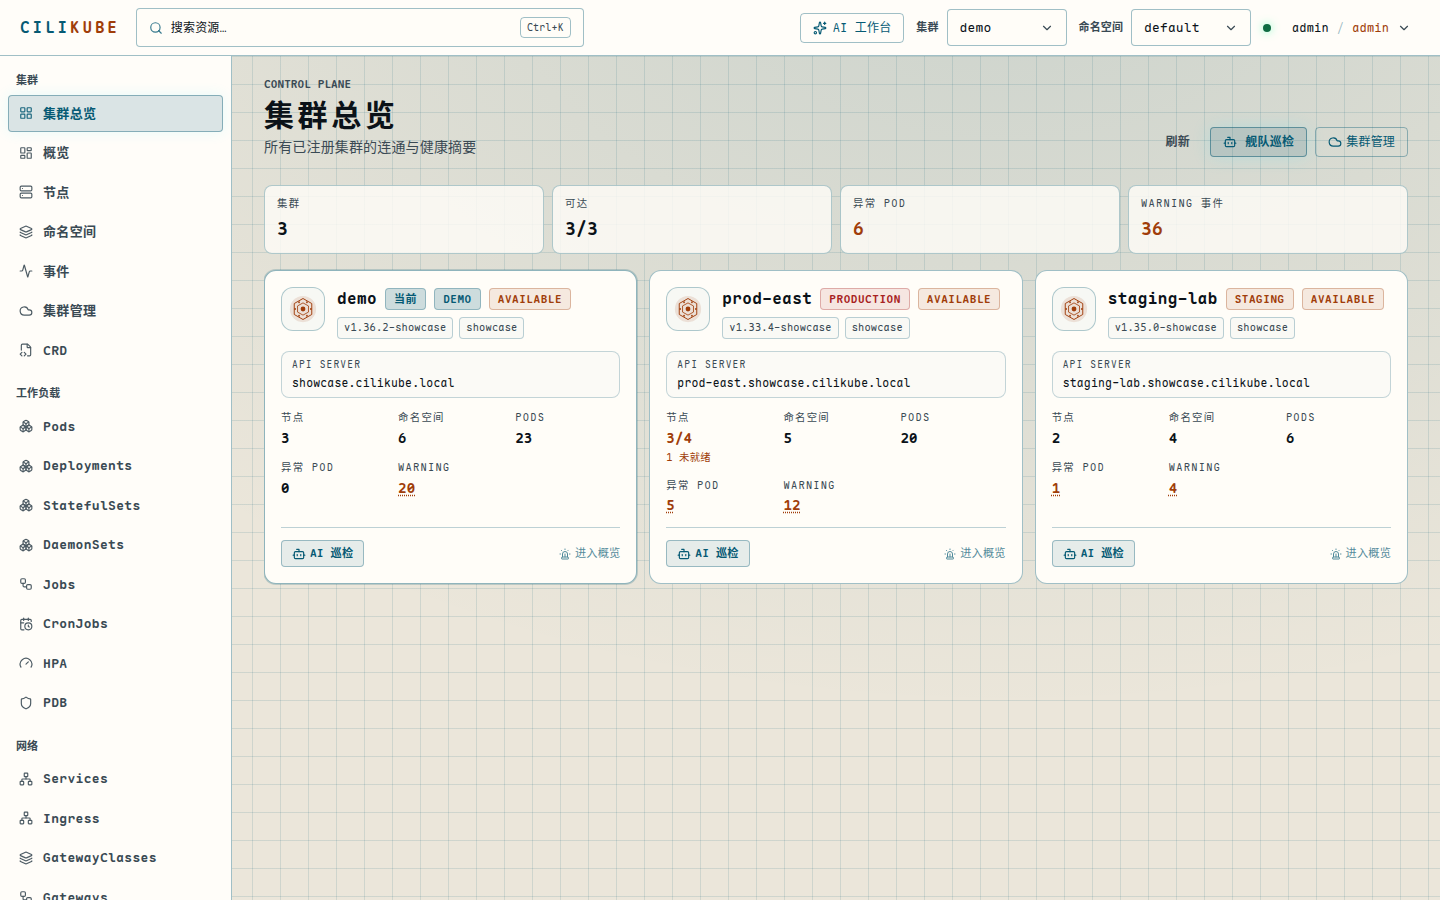
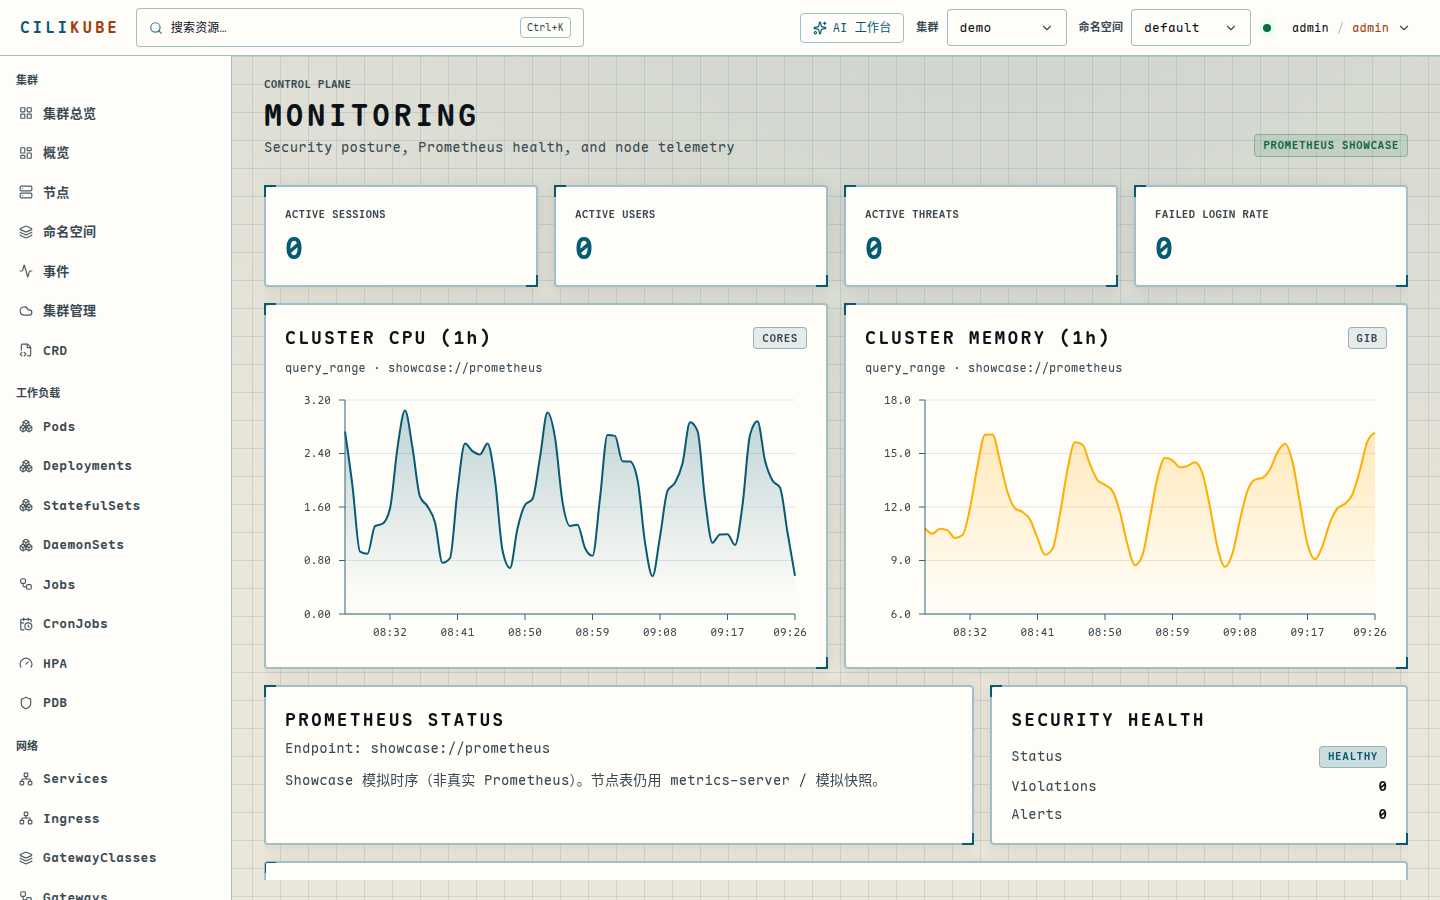
UI changed, goal didn’t — fewer window switches when managing clusters; opening move went from “browse the menu” to “ask what’s wrong first,” and with multiple clusters you can glance at the overview before diving into one
What’s different: CiliKube AI
Most K8s consoles (Dashboard, multi-cluster panels) share a path: left-hand tree, then Nodes, Pods, logs — you already need to know where to click
CiliKube tries the reverse — login lands on the AI page, console sits in the top bar for when you need YAML, terminals, or careful inspection
Simply put:
AI is the navigator / read-only investigator; the console remains the source of truth
It won’t randomly mutate your cluster; default path is AI reasoning plus read-only tools (overview, list, get, log samples) for “how is it now,” “what’s broken,” “recent logs for this Pod,” and answers attach resource clues you can open in detail or logs
Default agent is one: the cluster investigator — read-only verification, then you go to the console, no multi-agent theater
On top sits a light Skill layer: not a separate “skill center” sidebar, just short searchable playbooks
- Landing groups Featured / Inspect / Troubleshoot / Navigate — smart check, quick investigate, cluster pulse, fault scan, event hotline… one click to start
- Type
/in the composer (or the Skill button) for a picker; ↑↓ + Enter; usable mid-chat too - Custom Skills: name + prompt in the browser; turn habitual questions into something
/can find next time
Another piece I care about — the console can call AI back. From Pod / Deployment detail (and list rows), Investigate with AI opens a new chat with kind / namespace / name, asking status, events, logs when needed — still read-only. So the loop is AI → clue into console → stuck → investigate again, not “chat then fall into a menu dead-end”
For multi-cluster there’s a Fleet overview: cards with connectivity summary (nodes, namespaces, bad Pods, Warnings), env tags (prod / stage / …), per-card AI inspect, clickable anomaly counts. Page header has Fleet inspect — serial, priority-ordered checks across reachable clusters into one “fleet health” session (demo caps how many; you can stop mid-way)
Local chat history (rename, copy, delete, group by time) feels more like a daily tool than a blank box every time
Not “another ChatGPT shell in the sidebar” — AI is the entry, console is the deep dive, resource pages and fleet cards can throw context back to the investigator; asking first matches how I actually troubleshoot
Boundaries too: not an autonomous SRE, not “one sentence to ship a change”; writes, approvals, backups still matter; custom Skills are local prompt shortcuts, they don’t widen cluster RBAC; fleet inspect is serial read-only verification, not parallel mutation
Aside: what changed about AI while building this
Section above is product AI; this one is how the project got built
A year-plus ago, “AI” for most people still meant a chat box — ask, get a paragraph, paste code, tweak prompts; useful, closer to a strong search-plus-draft machine
Then tools moved from completion to multi-file edits, running commands, reading errors and continuing — into what we now call an Agent: you give direction and boundaries, it reads the repo, patches, runs checks, humans decide and accept
For hobby open source that’s concrete; evening progress used to be slice-by-slice on a full-stack panel, with AI-tool collaboration (skills, rules, multi-turn breakdowns) the same spare hours cover more surface. A large part of CiliKube’s rewrite, catch-up, and this AI entry lived in that rhythm
Honest bit: agents don’t auto-produce quality; fuzzy direction and weak boundaries still get confidently wrong answers — tools change, the habit of keeping systems stable shouldn’t
So this post is both a product follow-up and a footnote on tooling: outside, agents rewrite how we write code; inside, consoles should rethink what people see first
What it is and how to use it
Still an open-source Kubernetes multi-cluster management platform; the backend keeps talking to real Kubernetes APIs
Biggest usage change vs last year:
① Browser
Open the demo, land on AI, ask a couple of questions, then enter the console; top bar → fleet for three cards; share a link for trials and small-team demos
② Cross-platform desktop (Windows / macOS / Linux)
Double-click, embedded backend, reads local kubeconfig — manage your laptop cluster without standing up a web stack first. Packages are on Releases — not code-signed; macOS / Windows may need a manual allow on first open. Normal for small OSS; just know it
Same UI — not a thin desktop shell with half the features
Old Vue UI still at cilikube-web; mainline, demo, and desktop are React; new work lands in the main repo
What “later” looks like now
Old post promised RBAC, monitoring, logs; a good chunk is in place now:
- AI workspace: home after login, SSE chat, read-only tools, Skills (
/+ custom prompts), Investigate-with-AI from resources, session history, jump into the console - Fleet overview: health cards, env tags, per-card / fleet AI inspect, anomaly counts into investigate
- Multi-cluster import / switch (real clusters on desktop or self-host; demo is Showcase)
- Workloads, networking (incl. Gateway API), config, storage, RBAC objects
- Pod logs, web terminal, Events, global search
- Monitoring: metrics-server snapshots + Prometheus charts; Showcase curves on demo; self-host fills Settings → Prometheus
- Helm, API Proxy
- JWT, optional GitHub OAuth, Casbin roles, audit
- Multiple themes, Chinese UI
Not trying to replace every commercial suite; I care that there’s a console you’re willing to open daily — plus a layer: ask first, then change
Still learning in public
I’m still the person who learned Kubernetes by building this; that part hasn’t changed. AI keeps moving, so do we
What changed: less “scaffold for beginners only,” more a console I want open daily — browser or desktop, both can talk to your own clusters
Same open-source bet: it lives if people star, use, and leave a useful note
AI will keep getting sanded: model wiring, Skill quality, feeding real metrics into chat, MCP for external agents. Resource investigate and fleet inspect already work end-to-end — after you try the demo, tell me what’s awkward
Try it
Browser: https://cilikube.cillian.website
Login page can fill demo accounts in one click — admin for the full view, guest for browsing. Path I’d try:
Login → pick a Skill on the AI page (or / search for pulse / fault) → follow clues into Pod / logs → Investigate with AI again from detail
For multi-cluster: top bar → Fleet → click prod-east anomaly counts or AI inspect, or Fleet inspect for a summary; then Monitoring for Showcase series
Or enter the console from the top bar first and call Investigate when stuck; save frequent asks as custom Skills
For real clusters use the desktop build or self-host per the README. Self-host: Settings → AI for mock or an OpenAI-compatible API; Settings → Prometheus for a reachable URL before charts go real
If it feels useful, a Star helps: https://github.com/ciliverse/cilikube
If you starred the Vue era — thank you for sticking around
Closing
A few lines that matter —
This year, AI outside moved from chat boxes to agents, and hobby open-source cadence changed with it; CiliKube moved from a Vue learning scaffold to browser + cross-platform desktop, and tried a path unlike classic consoles: AI triage first, console second
Meaning in life can stay fuzzy for a while; turning something you like into a product people can open — and talking with those who use it — already feels like enough
Same series also has CiliTerm, a more sci-fi flavored terminal — next time
Demo: https://cilikube.cillian.website
Desktop: https://github.com/ciliverse/cilikube/releases
GitHub: https://github.com/ciliverse/cilikube
Earlier WeChat post: https://mp.weixin.qq.com/s/4P-3l7cPYcubz6epj2FVqQ
AI notes: https://cillian.website/ai/